Sunday, 23 September 2012

Is it time to loosen fiscal policy?


The debate on the scope for looser fiscal policy just does not go away.  With every ONS release it seems, the cry for more action goes up.  But, unlike the popular media, I am not terribly interested in whether Keynes or Hayek are right or what they would have done.  Much to our, no doubt, great loss they are dead and so we must really work it out ourselves.   The key questions we have to ask are pretty obvious and yet is continually amazes me that the debate is so little illuminated by answers to these questions:

·         What is the level of public debt relative to income and is it on a sustainable path?
·         Relatedly, what is the financial market’s appetite for holding UK government debt – is the demand curve perfectly elastic or rather inelastic?
·         What is the likely level of spare capacity in the economy?

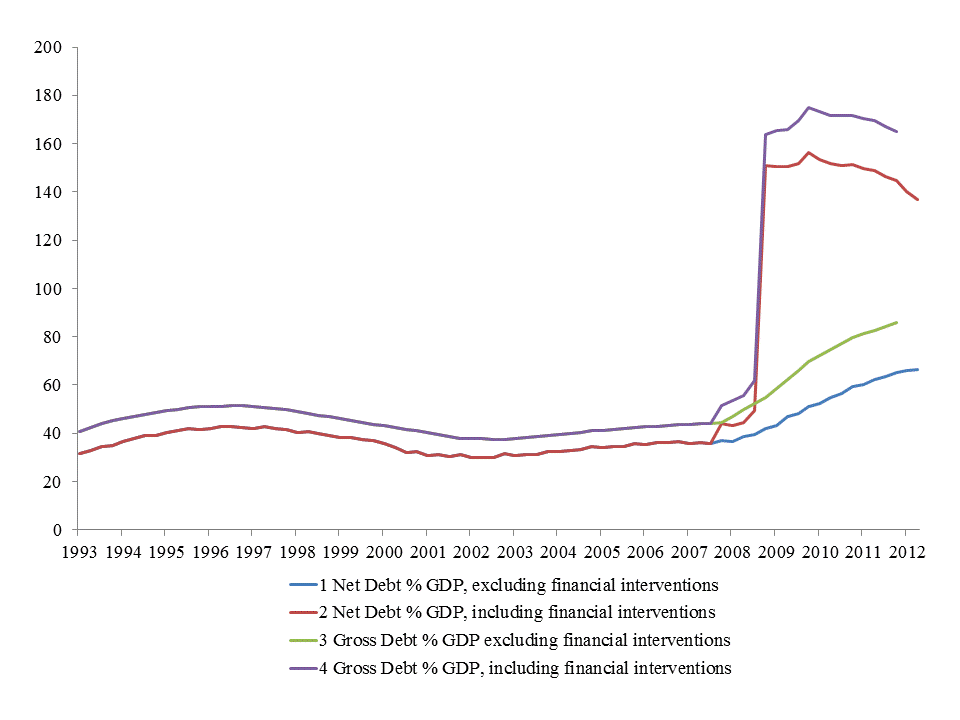
Your empirical answers to these questions will help frame your views on whether fiscal policy should be eased.  If you think that the level of debt is well characterised by net debt excluding financial interventions (66.2% at the end of the second quarter of 2012), that financial markets are willing to hold a lot more UK debt without asking for higher interest rates and there is a lot of spare capacity in the economy then I forecast that you will be asking for an end to fiscal consolidation and some activism.  On the other hand, is you think the total obligations of the public sector are large (around 165% on a gross basis at the end of 2011) relative to the financial market’s willingness to hold more debt and that there may not be very much spare capacity, the I forecast you will not be calling for a Fiscal Plan B.

The first chart below show the path of public to GDP under net and gross calculations including or excluding the obligations arising from assistance to the financial sector.  A nice stable path prior to 2007 is disrupted and shocked markedly upwards as the economy delivered a sequence of large negative growth rates and the banking sector required some recapitalisation.  My preferred measure of public debt  in normal times, gross debt (which accounts for all government debt issued and liabilities arising) has itself doubled since 2007.   When we add in financial interventions, it has quadrupled.  These kinds of debt numbers are unprecedented in peacetime in the UK and ought to warn us about any attempts to ease fiscal policy further.

 
It is said that the first round of QE (Bank of England-sponsored temporary purchases of bonds from the private sector over 2009 to 2010) knocked some 50 Bp off ten-year bonds yields (see Meaning and Zhu, 2012).  In other words by reducing the net supply of debt that has to be absorbed by the private sector, bond prices are higher than they would otherwise be and so yields correspondingly lower.  Although it is encouraging that these purchases had a significant impact on yields, the exact same net supply story also means that further debt issuance would actually raise yields unless accompanied by further QE operations.  I suppose it might possible to raise levels of public debt and keep interest rates low by ever larger quantities of QE but such a joint strategy really would amount to the monetary financing of fiscal deficits.  The basic idea of QE originally was to provide some direct impact on bond yields conditioned on the stance of fiscal policy not to allow the fiscal policy to issue more debt than they would otherwise have chosen.

Whether we want to issue a lot more debt might, apart from any nuances on monetary-fiscal interactions, really depend on our view of the amount of spare capacity in the economy, the output gap.  I have extended the most recent release for GDP (2012 q2) to the third quarter of 2015 using the most likely path of output from the Bank of England’s August Inflation Report.  And then run two very simple measures to de-trend: (i) a(n) (HP-)filter that allows the trend to vary over time and (ii) one that assumes the time trend is fixed.  Unsurprisingly the latter introduces significantly more variance into the cycle than the former.  The time trend suggests significant spare capacity whilst the filter suggests that the output gap has closed.  For comparison, I cross check these estimates against those of the OBR and find that their estimates are highly correlated with the filter but suggest on average a couple of percent more spare capacity.  If, in your view, more expansionary fiscal policy only affects demand and you do not believe in the time trend measure, then you also will not be inclined to argue for more expansionary fiscal policy.  


So rather than taking a high minded position on the philosophy of expansion and providing rhetoric on the need for growth, I would encourage economists to estimate some of these key parameters and so allow us to make a rational choice on the basis of the facts.  To the extent that we are uncertain of many key parameters, economics tends to advise policy to be employed in a cautious manner and that mean changing less rather than more.  It also means that the case for radical alternatives need to be fairly clear cut.  Now how about some analysis based on some numbers?

Wednesday, 26 October 2011

Insider Trading in China – what is and what should never be


Several newspapers reported yesterday that two Chinese officials have received jail sentences of six and five years for leaking confidential economic data to traders prior to their official release.   In one of my favourite films, Trading Places, the anti-heroes Randolph and Mortimer Duke try to obtain the crop report in advance of its release so they can corner the market in frozen orange juice.  Like their Chinese counterparts nearly 30 years later no good became of them either.  Insider dealing laws prevent those who have information in advance of the market, or public, from acting upon it.  And quite rightly so.

The news from China though can be understood at a number of levels.  First it confirms that economic news on the Chinese economy is sufficient to move to asset prices in a substantive and predictable manner.  Thus the market having formed expectations, news that does not completely verify those expectations leads to asset prices adjusting.  By the by, rational expectations does not mean that we know the news, it means that we have worked out the probability of different events and the payoff from those events.  When the uncertainty is resolved by the actual publication of the news, the event that actually happened goes from being a mere probability to a certainty and that is why asset prices move.  That Chinese data is valuable enough to change asset prices is significant enough and a positive development, per se.  We, or the financial intermediaries we employ on our behalf, are therefore forming views about the Chinese economy and then re-evaluating those views as news emerges.  The scrutiny, rather than the tyranny, of the market is a good thing.

Secondly, the successful prosecution means that authorities understand that market sensitive data must be released to all market participants simultaneously.   This does not mean that no information should be released or that only certain bits of information should be released.  All data on the state of the economy, revisions, warts and all, should be released on a well understood timescale and produced by a well-documented statistical process.   Such a process will facilitate the development of views on the likelihood of different state of nature and also – this is the important bit – facilitate the transfer of information from the private information set to the public domain.  The trader or analyst with a bearish view will 'sell' his or her analysis to market participants and be amply rewarded if they turn out to be right as prices will move to reflect the accuracy of the originator’s private information set.  The key is that the traders are rewarded for their private information and so have an incentive to work out what it might be through analysis. 

What is less clear is whether any of the clear sanctions against the release of public information will have any impact on what we have come to call 'guidance'.  It should not.  Guidance involves statements by policymakers on the implication of a given stream of data for likely future policy or backward-looking explanations of why what was carried out when.   Guidance, if given to all and is free to access, is helpful as it clarifies public thinking and so pools information.  The guidance is not private information nor is it data per se.  It helps markets interpret the large flow of information and understand better the conditions under which policy is currently being set and the parameters that might cause it to change.  To the extent that guidance accelerates learning and forces policy makers to spell out their reaction functions, guidance is less something to be proscribed but more an obligation.   The debate about the effectiveness of transparent as opposed to opaque policy relies on such guidance.  So at the same time that sanctions are developed again insider information, governments should work harder to explain, warn and advise.

Thursday, 20 October 2011

Have the MPC Blown It?


Inflation measured by either the CPI or the RPI has risen to over 5% this summer and autumn and is at levels clearly inconsistent with price stability.  At these inflation rates the price level will double in less than fifteen years.  The battle for price stability in the UK was fought over a prolonged period from the IMF programme of 1976 onwards and it seemed for a brief period in the 1990s and 2000s that the battle had been won.  The war, however, continues and there has been a significant rearguard action.


The chart shows not only an upward creep in the level of inflation but also its volatility from around 2003/4 onwards.  And to some degree that seems mirrored in the financial market perceptions of the inflation 10 years ahead, which also seem to have drifted up from lying in the range of 2-3% in 1997 through to around 2005 to now lie between 3-4% since 2008.  There are a number of technical reasons why the inflation forwards cannot be read at face value, particularly given the liquidity characteristics, but the trend does not seem terribly encouraging.  If we also believe that QE has lowered nominal forwards then the measures from the inflation forward may in fact be biased downwards.  And worryingly the Bank's own survey of inflation expectations from August places the median of medium inflation expectations at 3.5% compared to 3.2% and 2.8% a year and two years ago.  The temporary inflation overshoot looks as though it may turn out to be more persistent.

Perhaps it should not really surprise us. In response to a cost-push shock over the past few years, the MPC has eased monetary condition by allowing real rates to fall and committed to low interest rates via its programme of QE.  In the kind of models the Bank used to use, a cost-push shock required higher interest rates not lower ones and the argument used to be that acting against inflation was the best way to ensure that an inflation shock was temporary rather permanent.   It seems that we are now hoping that "something will turn up", or rather down. 

Naturally, the policy decisions have been rather more complicated than having to deal with a single cost-push shock as we did not start from steady-state and financial conditions remained tight in a recession.  As the cost-push shocks emerged at a time when there was considerable slack in the economy they will have acted to help close any output gap, it may then mean that the low current rate of growth is as likely to be related to the supply side as it is the demand side and so may not really be responsive to further monetary stimulus.  Low growth and high inflation? That sounds curiously familiar. 

Saturday, 15 October 2011

Spot the Asymmetric Shock


The crisis in the Eurozone has dominated financial market sentiment over the summer. And so I shall restart my blog by asking the following question. What is an asymmetric shock? The question, of course, stems from the basic condition for a sustainable monetary union: that the kind of shocks that lead to changes monetary policy should be highly correlated across any such union. If they are not highly correlated this will place the sustainability of the union under pressure as member countries face less then ideal policy rates. The more a country is different from the average the more it larger the boom and bust we will will observe over succesive business cycles.

The chart above shows the soveriegn debt bond spread over the Bund (10 year German benchmarks) from 1993 onwards for the nations that went on to join the Eurozone. The changes in spreads represent changes in market prices for default risk, liquidity premia and domestic preferences for holding debt. What we note is that there was dispersion in bond spreads prior to the adoption of the Euro and again after the start of the financial crisis. The bit in the middle corresponds to both the heyday of the Euro but also the period of excessive liquidity creation by the financial system.

It would seem at first glance that going back my original question it is the first and third periods that suggest asymmetric shocks. And that it is the middle period corresponds to some elimination of differences. The compression of spreads in the middle period tells that financial markets were treating different sovereign debt instruments denominated in Euro as very close substitutes during the Euro's heyday.  In effect, the markets treated the price of sovereign debt of countries that had different fiscal paths and growth prospects almost identically. 

This equal treatment of unequals seems to me to have imparted the ultimate asymmetric shock.  Rather than rationing debt with higher prices, the heyday of the Eurozone - possibly as the result of  some form of implicit centralised guarantee - encouraged financial markets to treat the various nations' debt as identically priced and so cheap to issue by any government.  In fact, many treated the convergence of spreads as evidence of Eurozone credibility when in fact it was storing up future problems.  Some of these nations responded, in some degree, by issuing too much debt and not correcting dangerous fiscal paths.  This meant that when there was a negative demand shock - a recession - some fiscal paths became unsustainable and financial market fears of default triggered contagion.  Asymmetric shocks are in the eye of the beholder.                  

Monday, 11 October 2010

Financial Markets Finally Awake to Eurozone Risk

This year the Eurozone has suffered its first existential crisis. Ongoing turmoil in financial markets has exposed the vulnerability of the public debt position in several Eurozone member states. The financial spreads amongst Eurozone countries against the benchmark (10-year German bond) Bund, which gauge the medium-term risk in the Eurozone, have not only escalated to historic highs but also have displayed increasing tendency to be skewed (roughly measured by the gap between median and average), as a group of countries are finally perceived as increasingly risky by financial market participants. A typical response to this crisis has been to ask for a Stabilisation Fund to support distressed Eurozone (EZ) economies and for meaningful restrictions to be placed on public debt levels for EZ member states. This may not be where to begin.


Two obvious factors explain the widening of these spreads, which in a credible monetary union ought to be negligible (as they should reflect mostly some small liquidity preferences for holding one country's public debt over another, with currency risk not really a concern). One of the consequences of the financial crisis is that financial markets are more willing to price risk into financial contracts and so a given quantity of risk, will wish to be paid a greater excess return than in the period prior to the crisis. The second reason is that the perceived quantity of risk has risen on average but also for some states in particular, as the first round response to tightening credit conditions and a contraction of world demand has been a large one-off increase in the level of public indebtedness.

The OCED report that that the level of outstanding government debt for advanced economies in 2009 was around 50% higher than its 2006 level (http://www.oecd.org/dataoecd/10/41/45988118.pdf, p. 19) but this alone seems unlikely to be able to explain the overall and specific increase in sovereign spreads. Part of the reason for the increase in spreads is their ‘compression’ to very low levels in the period leading up to 2007, which exaggerated the apparent change pre- and post-crisis. The question then is why did financial market prices, traded by highly intelligent and resourced investment bankers, for Eurozone sovereign debt display such insouciance to both the construction of a “non-optimal currency area” EMU and to the ongoing implication that public debt levels would have to rise as countries increasingly turned to fiscal policy to stabilise their domestic economies? What were the impediments to use of all available information? It is surely not that much news that certain Mediterranean states have public debt overhangs and were not especially well synchronised to the German economic cycle?

The favourite set of theories may be that there is a tendency for financial prices to herd, in the absence of full information. Some story involving the end of the business cycle, the longevity of the Euro, and belief in an implicit bail-out encouraged some herding which promoted a compression trade – buying higher yield sovereign debt funded in the currency of a lower yield sovereign. But a little more transparency on fundamental debt positions in the event of a prolonged asymmetric shock might have scared the markets into demanding country-level risk premia somewhat earlier. And so I can't help thinking that this kind of information and scrutiny on an on-going basis, alongside assessment of debt positions, may be of more value than a currency stabilisation fund.

Saturday, 2 October 2010

How much growth divergence will spit the Eurozone?

The main economic criterion for a monetary union across a set of economies is that they should be sufficiently synchronised so that the a single interest rate does a reasonably job in stabilising each economy in response to shocks. For this observation, Robert Mundell was awarded a Nobel prize in 1999. But even in any one long established nation state, this criterion often seems be a major challenge. In the UK, for instance as the story goes, the industrial north in the 1980s suffered a depression while south the benefited from a boom – on average there may have been some form of balance but perhaps not one that was ideal. This kind of schism also seems to have inflicted itself on the Eurozone.

A recession is a particular test of a monetary union, as it seems likely that the patience to accept slightly awry monetary policy from the perspective of any individual state may be more severely tested in a recession rather than boom. In this case, the credit shock that triggered the economic bust may have impacted in a different manner on the individual members of the monetary union and it seems likely that different countries may pull out of the recession more quickly than others, which implies a persistent divergence in growth rates. So has recession been associated with a wider distribution of growth rates in the Eurozone wider? Has it been associated with increased national differences in economic growth?


Let’s take a peek. The chart above gives the median year on year growth rate of members of the Eurozone (I exclude Slovakia, Malta and Luxembourg) and the inter-quartile range of annual growth rates, which acts to trim any extremes. Median year on year growth in the Eurozone was negative in the final quarter of 2008. The average inter-quartile range of growth rates was 2.4% prior to that quarter and it has been just over 3% subsequently. So there has been some increase in the dispersion of growth rates and in the first quarter of 2009, the inter-quartile range of growth was over 4%. So in principle, the one interest rate does not fit as well as it did.

But to me the increase is dispersion does not seem that great, I leave as an exercise the calculation of whether the differences in dispersion of growth rates are significant. Part of the reason here is that countries have been able to resort to an increase in public indebtedness to deal with their domestic output gaps. This response may well be a once-and-for all increase so could be replicated in the event of another downturn. But I do not know, and neither does anyone else know what the trigger point would be for a collapse in monetary union.


What is more important than the unconditional dispersion in growth rates in any one quarter across the countries, is the persistence of the deviation in any individual country from the median and what we can observe, even for Greece, is that sometimes it has been a winner and sometimes a loser so if the state can be patient enough EMU may even work for them, financial markets willing. (The chart below simply plots the inter-quartile range of growth rates and as red blobs year on year Greek economic growth.) We will return to that question next time.

Monday, 20 September 2010

Getting to Grip with a Double Dip

All I seemed to get asked at the moment is whether there will be a double dip. By which, I think, people mean whether the economy will experience another sustained period of negative growth. The UK recession started in 2008Q1 and continued until 2009Q3, which was relatively prolonged by the 'normal' standards of industrialised nations. Since then we have benefitted somewhat from three positive quarters of growth. As to whether we will have more quarters of negative growth, unfortunately I do not have the answer – and we shall simply have to wait. The typical forecast error of one-year ahead GDP growth is well over 1% and probably nearer to 2% of GDP warns me to be careful in making predictions. So much so that I would have be forecasting strong GDP growth of well over 2% in order to be reasonably sure that growth would be positive in the year ahead.

As with many question of economic policy, this one is badly formulated. It may matter, to some extent whether we think the economy is going to grow at +0.1% or -0.1%, with zero demarcating the difference between a happy and unhappy future for all. And some people do believe in some notion of a stalling speed for an economy, under which low or negative growth rates are more likely to lead to sustained lower and more negative growth rates in future: such a view might be based on the conjecture on confidence-based feedback loops from growth to employment prospects and vice versa. But ultimately more or less growth over a short period is less important than the extent of spare capacity.


And so the questions about which we ought to be thinking hardest, are not only about the extent of spare capacity but whether it will ultimately be dissipated by strong positive growth in demand or the scrapping of output potential. If the former, the long-lived consequences of the financial crisis and subsequent economic recession would be minimal but if the latter then we may have to learn some very hard but also permanent lessons about relative impoverishment. The chart above shows real GDP in the UK, Euroland, Japan and the US relative to their level at the end of the second quarter of 2007, which you will recall was a month or so before the financial crisis took its grip and I have arbitrarily normalised that quarter’s GDP level to 100. I also draw a simple trend line (dotted line) from 2001 to 2010, which shows where we might have expected the income to be this year if we had been foolish enough to believe a straight-line forecast in 2007. Even though the various recessions seem to have ended, the gap between expected income and actual income remains very large. In general, we can see, there is a shortfall of around 5-10% between the expected level of GDP and current income. A double dip or not, what matters is the persistence of this gap, which can be only be eroded quickly by some combination of fast growth and supply side scrapping. When we consider the indebtedness of household balance sheets, a nervous corporate sector and a trickle of bank lending – it is difficult to see how demand will quickly erode the gap. And if the decision-makers on the supply side then think that the gap must be closed by scrapping output, then we will all be permanently worse-off. Double dip or not that is the real question.