Monday, 22 October 2012

Did policymakers learn to blow bubbles in 1987?


We have not yet, as a profession, teased out the contribution to the business cycle from monetary policy actions.  This is, in part, because there is not only considerable dispute on how to measure monetary actions but also we know that any results will be heavily dependent on the particular model that is chosen.  There is another reason.  We tend to think of policy as acting to stabilise the economy from shocks, so that agents will plan over the longer run in a manner consistent with the policymakers key objectives.  But what if policy gets it wrong from time to time?  Then it has the ability to increase as well as reduce the volatility of the economic cycle.  And so working out the contribution to an event from something that both may have caused it and responded to it, turns out to be quite hard.

On Friday, at both my lectures, I reminded my students of the events of 19th October 1987, so-called Black Monday.  Or rather given their youth, offered the historical account.  Although this was a global event, I concentrated on the FT100.   The index of leading companies, see Figure, was based to 1000 in January 1984.  So we can see that by New Year’s Day on 1987, there had been a 68% increase in three years, implying an annual return of just under 19% and the index stood at 1679.  By 16th July, the index had gained another 764 points to reach 2443, giving a further 46% return in just over half a year.  The correction to this boom was rapid.  There was an 11% fall in the index on Monday, followed by further falls on Tuesday, Thursday and Friday.  So by the end of that week, the index was at 1684 and nearly 27% down on the previous Friday close.  There are a number of contemporary accounts of the proximate causes of this large correction: margin calls, automated stop-loss trades, trading desks-cum-ghost towns as a storm prevented people manning the desks but all seem to suggest to me simply that any downward correction may have been somewhat amplified (See Carlson, 2007, for a nice summary of the the US view).

 
The question facing policymakers was whether this fall in equity prices was a bubble bursting or a market re-valuation of firms’ profitability.  The former implies some form of correction back to fundamentals but the latter change in the underlying profitability of the large firms and by association the economy.  Either way, of course, the possibility of panic remained so perhaps something had to be seen to be done.  Indeed there was a considerable attempt to co-ordinate the responses across central banks throughout the world.  And so Bank Rate was cut from 9 7/8 by 150Bp in three steps, starting on Friday 23rd, to fall to 8 3/8 by early December.  Equity prices reached their lowest point after this crash on 9th November at 1565 and some sort of recovery in prices commenced.  Certainly there was no Great Depression as some doomsters (I should look up who they were) were arguing and the business cycle expansion continued until the last quarter of 1990.  With the benefit of considerable hindsight, it would appear that Black Monday was simply a correction and the policy response initially helped adjustment to the new path for equity prices.  In practice, subsequently, house prices were stoked up to a great extent, households became rather indebted and the economy subsequently could not bear the real rates required from continued membership of the ERM but I can tell that story another time.

And so when we turn to list the reasons for the financial crash of 2007/8, we do, I think, tend to overlook the role of excessively accommodative monetary policy in stoking the imbalances that the crisis finally revealed.  Equity market turbulence in the early years of this century led to super-accommodative monetary policy, alongside levels of transparency in policymaking that were designed to reduce uncertainty about the level and path of policy rates.  Casually, at least these policy choices seemed to have played a role in prolonging the business cycle and also supporting asset prices rather like the situation in the late 1980s.  A representative policy maker in their late forties or early fifties in 2003, would have been in his or her mid-to-late 30s in 1987 and I wonder to what extent the experience of 1987 was instructive.  I doubt we shall be able to point the finger for the causes of this crisis at policymakers who had learnt formative lessons as to how to respond to a crises with the Big One in 1987 but I wonder if they did grow up to become bubble blowers?

Tuesday, 9 October 2012

An OMT swap versus a QE injection - how should central banks buy bonds?


The ECB is planning to undertake a form of bond yield stabilisation for peripheral countries with a new tool, Outright Monetary Transactions, to deal with the on-going Sovereign Debt Crisis in the Euro Area.  Many people are treating this as another example of non-conventional monetary policies that will use central bank money to affect asset prices and at first glance it seems so as well.  But after some reflection, OMTs seem me to be a little more, and I hesitate to use the word, insidious and takes us right back to classic debates about whether monetary policy should prick bubbles and/or identify them.  The answer used to be no.  What mattered was the shock or structure that might have led to any mispricing and to try and deal with that by market reform or some examination of the implications of the shock for macroeconomic stability: central banks, so the argument ran, do not generally think they have more information than the market and so ought to concentrate on the cause of mispricing rather than attempt a direct correction - cause rather than symptom was the proper concern.

Under OMTs, in principle, there will be unlimited purchases of (one to three year maturity) distressed sovereign debt, providing the country whose debt is being purchased is on track under its IMF programme.  The purchases will be sterilised, presumably by sales of more stable sovereign debt, and so simply represent a re-shuffling of the bonds held by the private sector from distressed to more stable.  In effect the ECB is buying risky debt, financing it by selling less-risky debt and putting on a convergence trade so that it will make money if the risky debt goes up in price relative to the stable country’s debt.  In effect the ECB is doubling up, if its overall policy strategy works, it will lead both to a convergence in spreads and also a healthy rate of return, with perhaps a bonus for staff (!).

But rather like selling foreign exchange reserves to buy domestic currency, this kind of sterilised intervention is a kind of strategic game with the financial markets who though may collectively have deeper pockets than the central bank may not wish to challenge central bank policy institution-by-institution.   The idea is that the excessive risk spread does not represent a fair reflection of the credit risk of an individual sovereign but somehow results from contagion or bubble-like forces.  This opens up a number of issues: (i) should the ECB behave like a hedge fund, or specifically as the counterpart to the break-up trade put on by a typical highly leveraged financial institution?; (ii) how do we estimate robustly the fundamental and non-fundamental component of any asset price and esnure that our purchases bring the price to fundamental value?; (iii) how do we contain any moral hazard issues arising, whereby debt issuers may feel they can “misbehave” in the presence of ECB insurance?; (iv) to what extent are ECB purchases of sovereign debt an attempt to offset structural weaknesses in its own policy design – given the financial markets pricing of exit or redomination reflects ECB policy - and so can further ECB policy be used to assuage risks in its own policy? (v) can open market operations of this sort, deal with the structural payments problems and debt overhang faced by Euro Area countries?  My answers to all of the above makes me rather worried about the ultimate efficacy of OMTs.

So you may ask why is QE any better?  I am not completely sure.  But QE is about swapping interest bearing reserves for government bonds held by the non-bank financial sector.  And this swap is specifically designed to replicate the impact of a notional cut in Bank rate, so that 10 year government yields fall to the point that they would have done if we could have had negative Bank rate or equivalently a longer duration of Bank rate at the zero lower bound (ZLB).  The swap is designed to be reversed so that any reserves issued will go out of circulation – with no permanent impact on the price level.  So QE adds us to a temporary injection of reserves that leaves the private sector long (liquid) reserves and short (less liquid) bonds for an uncertain but extended time.   Given the hedge fund analogy, the Bank of England and HMT in this case is actually betting against itself because when (or if) the economy stabilises it will take a large loss on the bonds it has bought.  In some sense, because “it is betting on the opposition" and so providing a commitment technology of the sort that says believe us when we say that we will keep interest rates low for as long as is required because when they are raised it will cost us a heck of a lot of money.

OMTs, on the other hand, are not designed as an instrument to compensate for the ZLB but result from some view that the market-determined rate for distressed sovereign spreads incorporates something other than credit risk, that is not well pinned down by fundamental factors such as the current and prospective stance of fiscal policy alone. Remember if they were on track during an IMF programme, the spreads ought to come back in. And so that is why, OMT sounds more like the defence of an exchange rate peg rather than a QE-type policy.  The advantage here, compared to an exchange rate peg, is that this interest rate peg is being defended by domestic central bank money.  But because  operations are to be sterilised, there is no overall change in the relative quantities of bonds and money simply the risk composition of debt held by the private sector.  The literature on sterilised interventions in forex markets does not suggest any great hopes for OMTs.  I therefore wonder whether OMTs should be unsterilised so that at least the exchange rate can jump downwards.  

Overall there clearly is a missing instrument (or two or seventeen) in the Euro Area, which might be a form of country specific non-conventional policy, it is just that I am not sure that OMTs as they currently stand are the answer.  What we probably need is more debt issued by stable sovereign states, i.e. Germany, which might give the central bank more ammunition.  It is this debt that could then be bought by a QE-style operation that would increase central bank money and might well help lead to a large depreciation in the Euro.  And then for some kind of swap between risky and less risky debt in specific lots. I will return to this question.  Meanwhile OMT looks at least one or two letters short of being the required instrument.

Monday, 1 October 2012

What is an Old Lady to Do? Nominal Income or Inflation Targeting

    There are growing calls to consider moving from inflation targets to nominal income targets as the prime objective of monetary policy. There is much merit in such a move. No central bank model yet can accurately forecast the split between real and nominal GDP particularly well as this requires us to understand whether shocks currently driving the economy are primarily demand or supply and also what the slope of short run aggregate supply curve is, which is itself likely to vary with an unknowable level of spare capacity. So the argument runs, let's limit ambition and simply target real GDP growth and, broadly speaking, inflation jointly rather than the latter explicitly and the former implicitly (because inflation is generally thought to be consequence of lagged, current and expected output gaps). Maybe.

    And so this morning, I ran a little simulation of a small macro model with either one of a nominal income targeter and an inflation targeter at the helm. This model is standard with consumption, output, fiscal expenditure, overseas demand, cost-push and a Phillips curve and both a fiscal and monetary policy maker. The Figure below shows us that inflation will rise more and consumption fall less when there is a nominal income targeter in office rather than an inflation targeter in the presence of cost-push shock i.e. ones that depress output and raise inflation. In this simple simulation, the response of agents embeds the policy reaction function and so leads to a higher inflation response because of higher expected output growth when the policy maker is told to care equally about inflation and output compared to being given an inflation target alone. So if you want to see higher nominal growth following cost-push shocks then nominal income targetry may be for you.  On the other hand when we allow the model to be buffeted by a panoply of shocks, such as, autonomous spending, changes in the velocity of money and also fiscal expenditure, the results look quite different: although the variability of household consumption is broadly similar when simulated over the long run, both of nominal interest rates and inflation are significantly more volatile under an nominal income targets. There main reason here, I think, is because fiscal policy is already assigned to the control of output, in these kinds of models, by then also asking monetary policy to consider output, we end up with the two policy arms wrestling somewhat with each other (see Chadha and Nolan, 2003, pp55-57).

Response of consumption, policy rates and inflation to a cost-push shock


    With appropriate assignment, and institutional reform, it may not always follow, of course, that more volatility may be injected by a nominal income target but I am not convinced yet about the need for any change. The main impetus for changes in policy have arisen from the real failures identified during this ongoing financial crisis, which involved an incomplete integration of financial factors in an understanding of what determined macroeconomic stability. And a quick glance at the data do not suggest that nominal GDP growth was especially excessive in the run-up to the financial crisis (see Chadha and Holly, 2011, pp 12 and 29 on this point), though it was perhaps a little stronger than some policymakers would have wanted. But what we probably needed more was a story of why excessive growth in monetary balances, debt and house prices did not show up in the aggregate numbers: what has been called a balance sheet expansion and recession. And so I am not sure that a targeting regime that forced the policymaker to concentrate his or her mind on nominal output rather than inflation would have forced a balanced assessment of (im)balance(d) sheets. Furthermore most of the results I have seen about how to escape a balance sheet recession-cum-liquidity trap seem to involve some form of commitment to inflate, so that the real value of debt is eroded. Moving to nominal income target may well make such signals about the likely future path of inflation hard to impart. Either way, I think the answer is not so much about the form of target but the quality of the analysis about the ongoing developments in the economy and how any emergent problems ought to be stabilised.

Sunday, 23 September 2012

Is it time to loosen fiscal policy?


The debate on the scope for looser fiscal policy just does not go away.  With every ONS release it seems, the cry for more action goes up.  But, unlike the popular media, I am not terribly interested in whether Keynes or Hayek are right or what they would have done.  Much to our, no doubt, great loss they are dead and so we must really work it out ourselves.   The key questions we have to ask are pretty obvious and yet is continually amazes me that the debate is so little illuminated by answers to these questions:

·         What is the level of public debt relative to income and is it on a sustainable path?
·         Relatedly, what is the financial market’s appetite for holding UK government debt – is the demand curve perfectly elastic or rather inelastic?
·         What is the likely level of spare capacity in the economy?

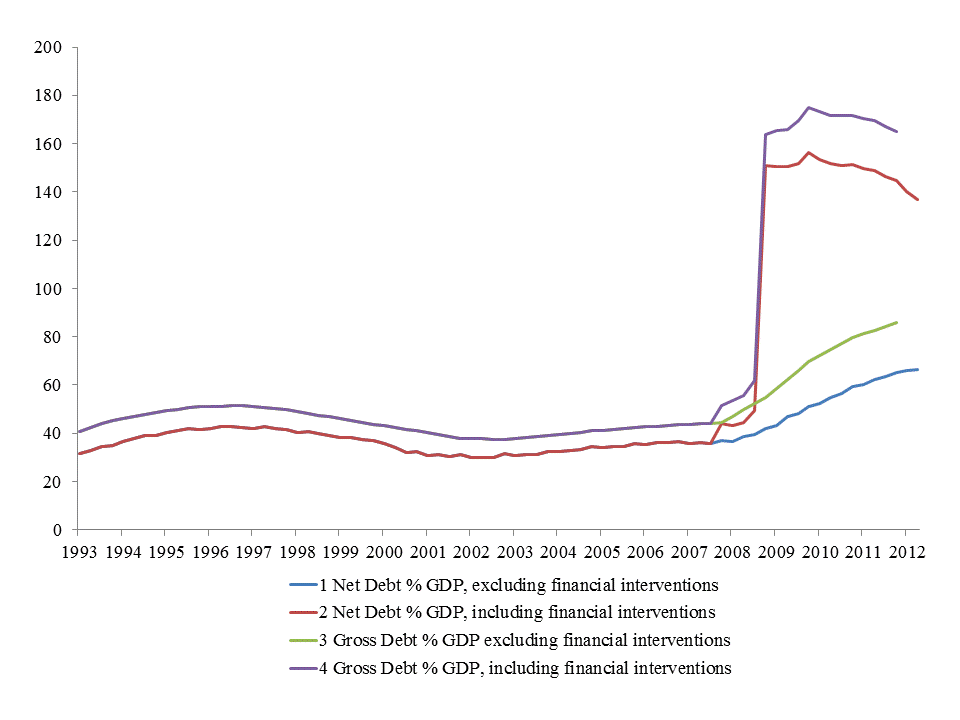
Your empirical answers to these questions will help frame your views on whether fiscal policy should be eased.  If you think that the level of debt is well characterised by net debt excluding financial interventions (66.2% at the end of the second quarter of 2012), that financial markets are willing to hold a lot more UK debt without asking for higher interest rates and there is a lot of spare capacity in the economy then I forecast that you will be asking for an end to fiscal consolidation and some activism.  On the other hand, is you think the total obligations of the public sector are large (around 165% on a gross basis at the end of 2011) relative to the financial market’s willingness to hold more debt and that there may not be very much spare capacity, the I forecast you will not be calling for a Fiscal Plan B.

The first chart below show the path of public to GDP under net and gross calculations including or excluding the obligations arising from assistance to the financial sector.  A nice stable path prior to 2007 is disrupted and shocked markedly upwards as the economy delivered a sequence of large negative growth rates and the banking sector required some recapitalisation.  My preferred measure of public debt  in normal times, gross debt (which accounts for all government debt issued and liabilities arising) has itself doubled since 2007.   When we add in financial interventions, it has quadrupled.  These kinds of debt numbers are unprecedented in peacetime in the UK and ought to warn us about any attempts to ease fiscal policy further.


It is said that the first round of QE (Bank of England-sponsored temporary purchases of bonds from the private sector over 2009 to 2010) knocked some 50 Bp off ten-year bonds yields (see Meaning and Zhu, 2012).  In other words by reducing the net supply of debt that has to be absorbed by the private sector, bond prices are higher than they would otherwise be and so yields correspondingly lower.  Although it is encouraging that these purchases had a significant impact on yields, the exact same net supply story also means that further debt issuance would actually raise yields unless accompanied by further QE operations.  I suppose it might possible to raise levels of public debt and keep interest rates low by ever larger quantities of QE but such a joint strategy really would amount to the monetary financing of fiscal deficits.  The basic idea of QE originally was to provide some direct impact on bond yields conditioned on the stance of fiscal policy not to allow the fiscal policy to issue more debt than they would otherwise have chosen.

Whether we want to issue a lot more debt might, apart from any nuances on monetary-fiscal interactions, really depend on our view of the amount of spare capacity in the economy, the output gap.  I have extended the most recent release for GDP (2012 q2) to the third quarter of 2015 using the most likely path of output from the Bank of England’s August Inflation Report.  And then run two very simple measures to de-trend: (i) a(n) (HP-)filter that allows the trend to vary over time and (ii) one that assumes the time trend is fixed.  Unsurprisingly the latter introduces significantly more variance into the cycle than the former.  The time trend suggests significant spare capacity whilst the filter suggests that the output gap has closed.  For comparison, I cross check these estimates against those of the OBR and find that their estimates are highly correlated with the filter but suggest on average a couple of percent more spare capacity.  If, in your view, more expansionary fiscal policy only affects demand and you do not believe in the time trend measure, then you also will not be inclined to argue for more expansionary fiscal policy.  


So rather than taking a high minded position on the philosophy of expansion and providing rhetoric on the need for growth, I would encourage economists to estimate some of these key parameters and so allow us to make a rational choice on the basis of the facts.  To the extent that we are uncertain of many key parameters, economics tends to advise policy to be employed in a cautious manner and that mean changing less rather than more.  It also means that the case for radical alternatives need to be fairly clear cut.  Now how about some analysis based on some numbers?

Wednesday, 26 October 2011

Insider Trading in China – what is and what should never be


Several newspapers reported yesterday that two Chinese officials have received jail sentences of six and five years for leaking confidential economic data to traders prior to their official release.   In one of my favourite films, Trading Places, the anti-heroes Randolph and Mortimer Duke try to obtain the crop report in advance of its release so they can corner the market in frozen orange juice.  Like their Chinese counterparts nearly 30 years later no good became of them either.  Insider dealing laws prevent those who have information in advance of the market, or public, from acting upon it.  And quite rightly so.

The news from China though can be understood at a number of levels.  First it confirms that economic news on the Chinese economy is sufficient to move to asset prices in a substantive and predictable manner.  Thus the market having formed expectations, news that does not completely verify those expectations leads to asset prices adjusting.  By the by, rational expectations does not mean that we know the news, it means that we have worked out the probability of different events and the payoff from those events.  When the uncertainty is resolved by the actual publication of the news, the event that actually happened goes from being a mere probability to a certainty and that is why asset prices move.  That Chinese data is valuable enough to change asset prices is significant enough and a positive development, per se.  We, or the financial intermediaries we employ on our behalf, are therefore forming views about the Chinese economy and then re-evaluating those views as news emerges.  The scrutiny, rather than the tyranny, of the market is a good thing.

Secondly, the successful prosecution means that authorities understand that market sensitive data must be released to all market participants simultaneously.   This does not mean that no information should be released or that only certain bits of information should be released.  All data on the state of the economy, revisions, warts and all, should be released on a well understood timescale and produced by a well-documented statistical process.   Such a process will facilitate the development of views on the likelihood of different state of nature and also – this is the important bit – facilitate the transfer of information from the private information set to the public domain.  The trader or analyst with a bearish view will 'sell' his or her analysis to market participants and be amply rewarded if they turn out to be right as prices will move to reflect the accuracy of the originator’s private information set.  The key is that the traders are rewarded for their private information and so have an incentive to work out what it might be through analysis. 

What is less clear is whether any of the clear sanctions against the release of public information will have any impact on what we have come to call 'guidance'.  It should not.  Guidance involves statements by policymakers on the implication of a given stream of data for likely future policy or backward-looking explanations of why what was carried out when.   Guidance, if given to all and is free to access, is helpful as it clarifies public thinking and so pools information.  The guidance is not private information nor is it data per se.  It helps markets interpret the large flow of information and understand better the conditions under which policy is currently being set and the parameters that might cause it to change.  To the extent that guidance accelerates learning and forces policy makers to spell out their reaction functions, guidance is less something to be proscribed but more an obligation.   The debate about the effectiveness of transparent as opposed to opaque policy relies on such guidance.  So at the same time that sanctions are developed again insider information, governments should work harder to explain, warn and advise.

Thursday, 20 October 2011

Have the MPC Blown It?


Inflation measured by either the CPI or the RPI has risen to over 5% this summer and autumn and is at levels clearly inconsistent with price stability.  At these inflation rates the price level will double in less than fifteen years.  The battle for price stability in the UK was fought over a prolonged period from the IMF programme of 1976 onwards and it seemed for a brief period in the 1990s and 2000s that the battle had been won.  The war, however, continues and there has been a significant rearguard action.


The chart shows not only an upward creep in the level of inflation but also its volatility from around 2003/4 onwards.  And to some degree that seems mirrored in the financial market perceptions of the inflation 10 years ahead, which also seem to have drifted up from lying in the range of 2-3% in 1997 through to around 2005 to now lie between 3-4% since 2008.  There are a number of technical reasons why the inflation forwards cannot be read at face value, particularly given the liquidity characteristics, but the trend does not seem terribly encouraging.  If we also believe that QE has lowered nominal forwards then the measures from the inflation forward may in fact be biased downwards.  And worryingly the Bank's own survey of inflation expectations from August places the median of medium inflation expectations at 3.5% compared to 3.2% and 2.8% a year and two years ago.  The temporary inflation overshoot looks as though it may turn out to be more persistent.

Perhaps it should not really surprise us. In response to a cost-push shock over the past few years, the MPC has eased monetary condition by allowing real rates to fall and committed to low interest rates via its programme of QE.  In the kind of models the Bank used to use, a cost-push shock required higher interest rates not lower ones and the argument used to be that acting against inflation was the best way to ensure that an inflation shock was temporary rather permanent.   It seems that we are now hoping that "something will turn up", or rather down. 

Naturally, the policy decisions have been rather more complicated than having to deal with a single cost-push shock as we did not start from steady-state and financial conditions remained tight in a recession.  As the cost-push shocks emerged at a time when there was considerable slack in the economy they will have acted to help close any output gap, it may then mean that the low current rate of growth is as likely to be related to the supply side as it is the demand side and so may not really be responsive to further monetary stimulus.  Low growth and high inflation? That sounds curiously familiar. 

Saturday, 15 October 2011

Spot the Asymmetric Shock


The crisis in the Eurozone has dominated financial market sentiment over the summer. And so I shall restart my blog by asking the following question. What is an asymmetric shock? The question, of course, stems from the basic condition for a sustainable monetary union: that the kind of shocks that lead to changes monetary policy should be highly correlated across any such union. If they are not highly correlated this will place the sustainability of the union under pressure as member countries face less then ideal policy rates. The more a country is different from the average the more it larger the boom and bust we will will observe over succesive business cycles.

The chart above shows the soveriegn debt bond spread over the Bund (10 year German benchmarks) from 1993 onwards for the nations that went on to join the Eurozone. The changes in spreads represent changes in market prices for default risk, liquidity premia and domestic preferences for holding debt. What we note is that there was dispersion in bond spreads prior to the adoption of the Euro and again after the start of the financial crisis. The bit in the middle corresponds to both the heyday of the Euro but also the period of excessive liquidity creation by the financial system.

It would seem at first glance that going back my original question it is the first and third periods that suggest asymmetric shocks. And that it is the middle period corresponds to some elimination of differences. The compression of spreads in the middle period tells that financial markets were treating different sovereign debt instruments denominated in Euro as very close substitutes during the Euro's heyday.  In effect, the markets treated the price of sovereign debt of countries that had different fiscal paths and growth prospects almost identically. 

This equal treatment of unequals seems to me to have imparted the ultimate asymmetric shock.  Rather than rationing debt with higher prices, the heyday of the Eurozone - possibly as the result of  some form of implicit centralised guarantee - encouraged financial markets to treat the various nations' debt as identically priced and so cheap to issue by any government.  In fact, many treated the convergence of spreads as evidence of Eurozone credibility when in fact it was storing up future problems.  Some of these nations responded, in some degree, by issuing too much debt and not correcting dangerous fiscal paths.  This meant that when there was a negative demand shock - a recession - some fiscal paths became unsustainable and financial market fears of default triggered contagion.  Asymmetric shocks are in the eye of the beholder.